• DG Betting Blog
It is really difficult to predict golf. Here’s why: in the graph below we’ve plotted a 50-round moving average of 1000 draws of a normally distributed variable with a mean of 0 and a standard deviation of 2.75. (In lay terms: we are going to pull 1000 consecutive numbers at random from a set of possible numbers that have a mean of zero and are clustered around zero.)
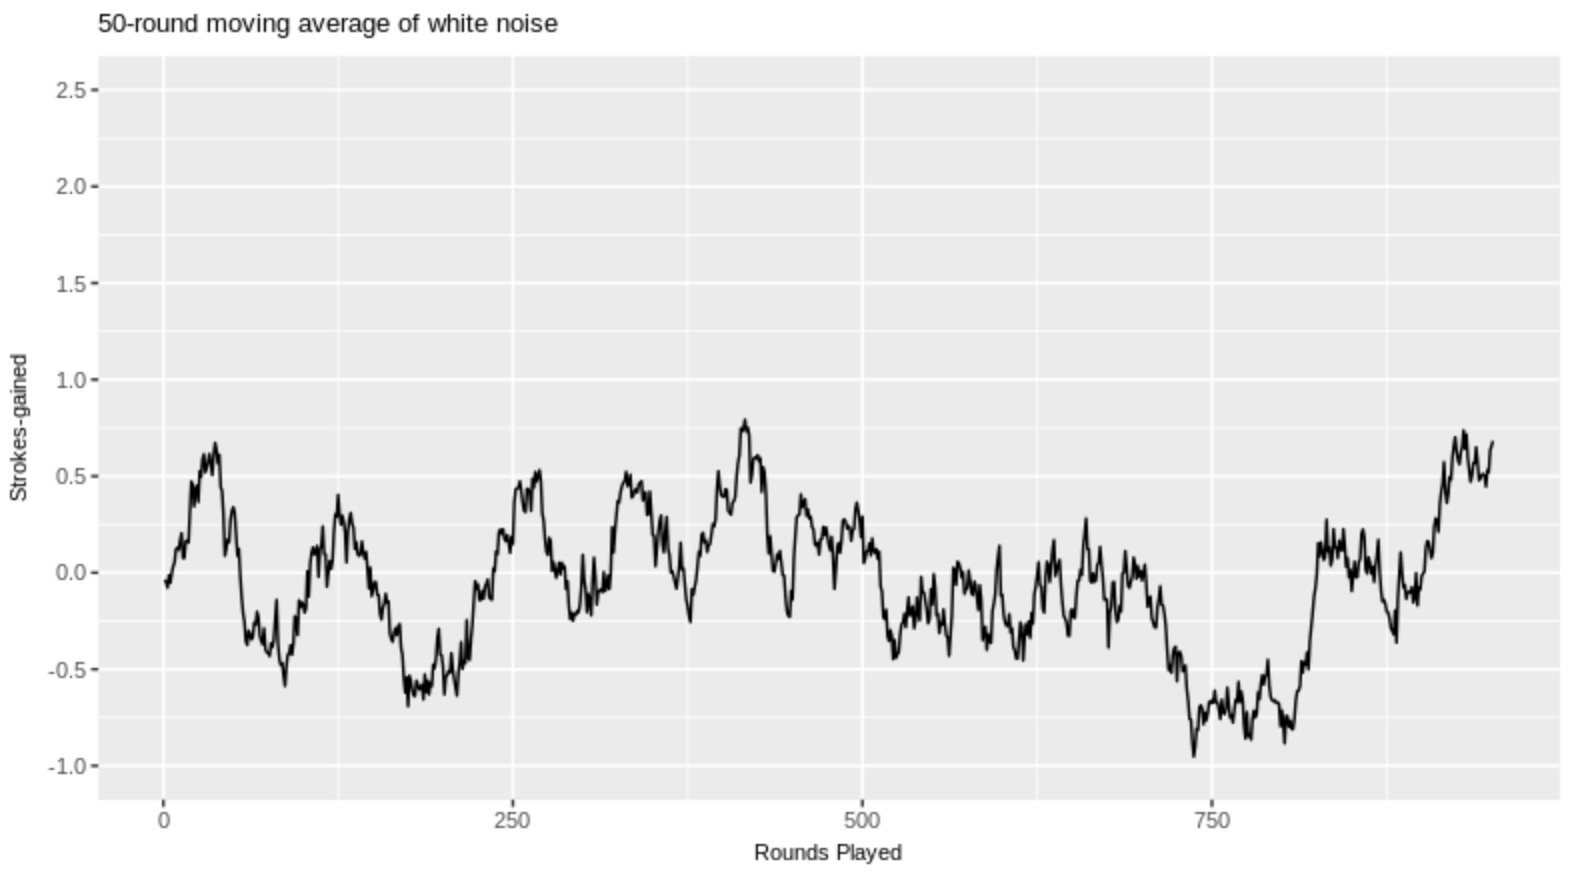
This is pretty incredible. The key point here is that there is no persistence in these scores. Every single data point is a random draw from the same distribution with a mean of 0 and a standard deviation of 2.75. Any movement you see here in the 50-round moving average does not reflect actual changes in the true mean of the random variable! To relate it to golf we can think of this as a time series of a golfer’s scores. A full-time golfer plays roughly 100 rounds per year, so this is equivalent to roughly 10 seasons worth of scores. Nearly everyone (ourselves included) would look at this and assume that the golfer’s ability has changed over time. It’s astonishing that the steady climb we see from round 750 onwards is possible given that the true mean (i.e. the ability) of our random variable (i.e. the golfer’s scores) has not changed! It’s actually the same old mean-zero golfer, but it is incredibly easy to be fooled by randomness. (Note: the value for the standard deviation of 2.75, which is crucial here, is our best estimate of how much a PGA Tour golfer’s scores vary day-to-day holding their ability constant).
This graph alone tells you why it’s so difficult to use course history as a useful predictor of performance. Look how much movement we have using a 50-round average; a 10 or 20-round average (i.e. the typical number a golfer will have played at a given course in his career) will display even wilder movements. Put simply, what this means is that small samples of performance in golf need to be interpreted with care. And “small” realistically means anything under 50 rounds.
All this being said, there are meaningful fluctuations in a golfer’s performance. Most golfers' performance charts display more variation than the graph above over the course of 10 seasons, which indicates that their abilities do change over time. The hard part is separating the signal from the noise.
An easy way to get a rough baseline for any golfer is to use our “true” strokes-gained tool which visualizes performance trends over time. Plotted below is Joel Dahmen’s total strokes-gained trend:
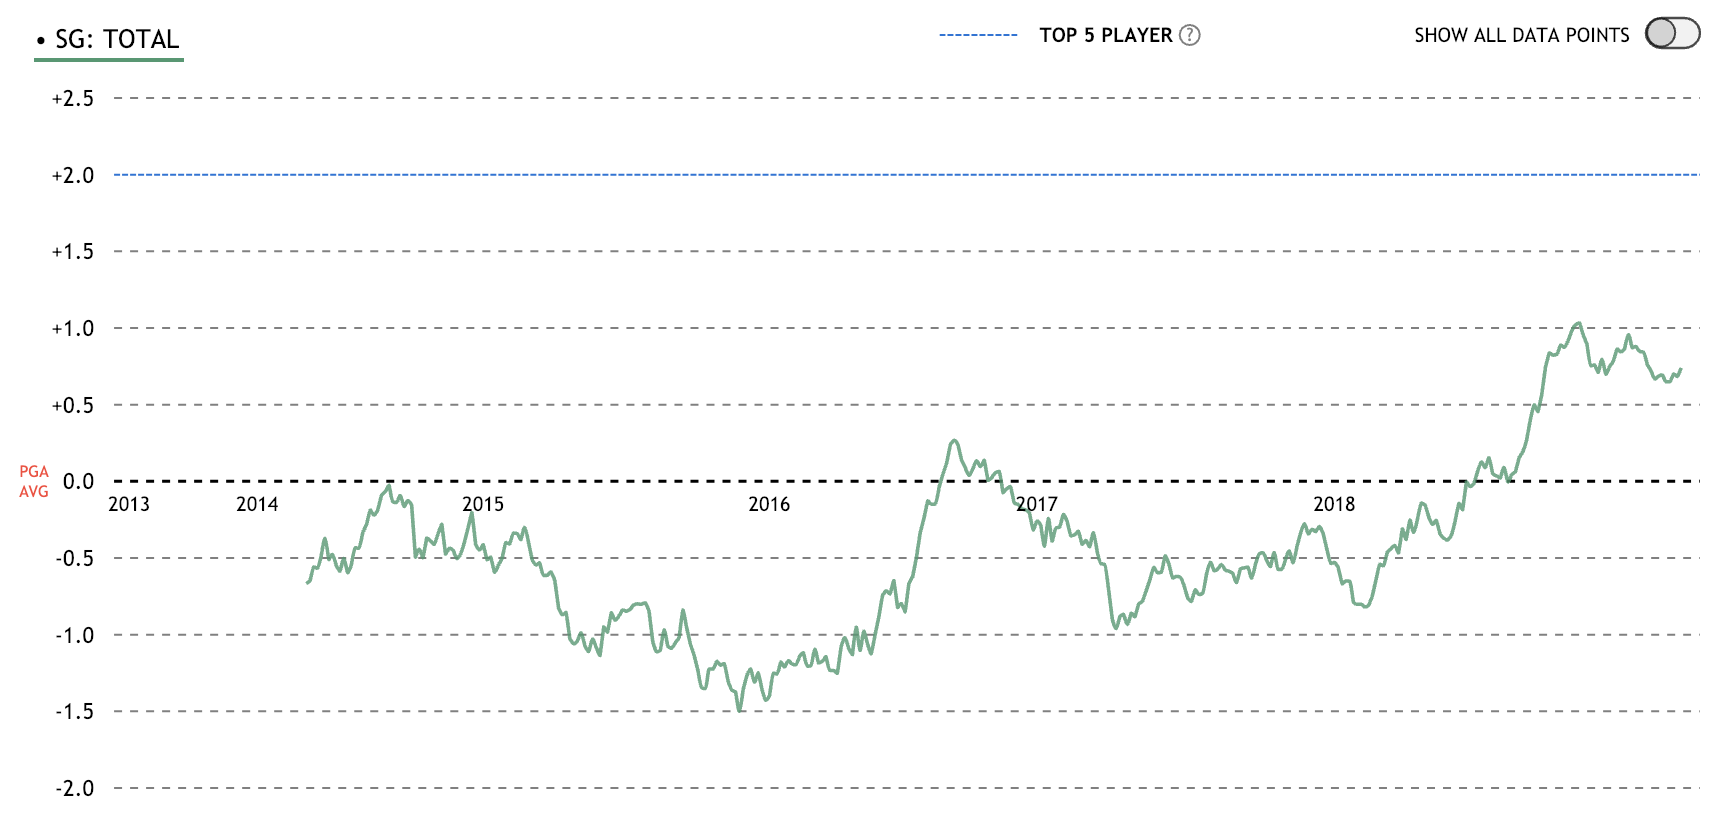
Dahmen’s performance has steadily improved since the start of the 2018 season, with his 50-round moving average increasing by more than 1.5 strokes. While it’s certainly possible that this improvement is only temporary, and is simply a product of the statistical gods playing a funny trick, it’s not likely. In our 10-season plot above, we didn’t observe any movements this large (although we almost did). We interpret Dahmen’s improvement as a partial signal: we don’t think his ability has improved by 1.5 strokes per round since 2017, but we think it’s likely that he’s improved a bit.
Another reason to believe this trend in performance is not fleeting is that it has been driven by Dahmen’s long game, specifically his iron play. As mentioned in last week’s blog, performance off-the-tee and with the irons is less variable than short game performance. (To convince yourself of this flip through a few players on our strokes-gained page: Rory’s driver does not go away for extended periods of time.)
The end result is that our model likes Joel Dahmen this week significantly more than the markets do. We think this is partly do to the fact that Dahmen’s uptick in performance has gone a bit under the radar, and also because we are giving him a significant boost due to his long-game performance. Bet365 is currently offering decimal odds of 7.0 for a Dahmen top 20 (implied odds of 14.3%). We estimate the corresponding probability to be 20.1%, making Dahmen our highest value top 20 play of the week.